Company Profit / Loss and Charts
Disclaimer:
I have of course removed all identifing information from the charts, and altered the budgets, time and monies spent so as to not disclose any private information of the company, it's clients or staff.
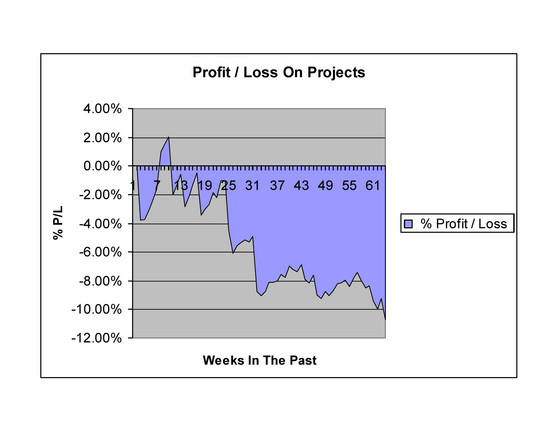
The chart remains illustrative of a company on the way up, which the company has been for many a year. My goal was to have the chart illustrate a company working back from a recession to profitability, a fairly common theme in the profession.
History
These sheets were the first P/L anlyasis the company ever used systematically. Previously, P/L was more or less determined from bank account balances and a summary of monies due and owed. Project managers would, or would not keep track of the P/L for their individual projects with varying degrees of effectiveness.
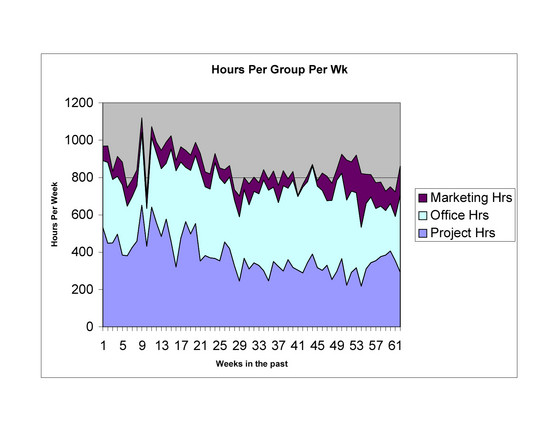
We used these sheets for nearly five years to track company wide profit / loss and to staff projects (that section is folded). Every week we would review the changes to P/L and staffing hours distribution and alter plans for the next week to keep profit and billable hour as high as possible. During the first two plus years illustrated by this chart we went from a severe loss to a small profit, and increased billable project time vs. overhead time. Needless to say, there probably were other issues, such as a change in economic cycles, however, we did use actively and every week use the anlyasis sheets to alter our staffing with the goal of increasing profit.
For the time period covered by this illustration, all tracking was done on a customized set of excel sheets. Each week I would run a time report for all the projects, export it to excel, massage the data, reordering lines to reflect changes to the job list for the week, and then cutting and pasting it into an excel sheet that would then automatically copy the data to the differing sheets, where calculations would occur and follow through to this summary sheet.
It wasn't horribly time consuming, but the necessity to do so every week at roughly the same time did interfere with my ability to take on projects. One of many instances my assistance with adminstrative tasks would interfere with building my portfolio.
We then decided we needed a better time keeping program, so that all staff could enter time and it would flow automatically into Quickbooks. We had previously been using accounting students to manually input from paper timesheets into Quickbooks. It's not as bad as it sounds, we had government clients who insisted on signed origional timesheets with each billing anyway. We picked a timekeeping program that would allow us to customize a report to look and calculate exactly like the excel summary sheet we had been using. This freed me up to be more flexible in my time again.
Notes on the anlyasis
The P/L is based on average hour costs. We later discovered that using the average we used was too high really. We were fairly successful in utilizing lower level staff to do much work and this would consistently result in the actual project cost coming in below that budgeted. This was of course a good thing, was planned for by the partners, and is a highly recommended management technique.
Therefore, all P/L numbers should be raised somewhat, resulting in a definite profit towards the end of the time covered by the chart. I wish I could say how much, but we never did much after anlyasis, we banked or distributed surpluses yearly and moved on. I know my last series of projects that ended in December 2009, showed by average hours cost to be running over 18% in the red, yet by actual monies spent, were running 8% in the black. I am particularly successful in utilizing lower level staff due to my willingness and ability to effectively task out work.
You might notice the first range of projects run at losses for the most part, this is to illustrate either poor record keeping by the PM or that scope and fee changes are happening too fast, or being approved too slow, to keep up with hours being worked. I have to say, it's not all that uncommon for this to occur in our profession. It is difficult when construction and occupancy schedules must be maintained to stop providing professional services until extra work authorizations are approved and signed. It is equally difficult to count on that money in an anlyasis like this, until they are signed.
You might also notice the effect of weighting. That is large projects running in the black effectively lifting up many smaller project running in the red. Again, not uncommon in the profession. While every project should be profitable, small projects are difficult to do so on, especially if being used to raise up / train new staff, as is often done.
The images below are of graphics representing the two main tracking goals, P/L and stafing.
The PDFs below contains the entire two page report project by project along with the two graphics.